
Excel vs Power BI Comparison
In today’s data-driven business world, professionals are expected to analyze, interpret, and present data effectively. Two of the most powerful tools used globally for data analysis and reporting are Microsoft Excel and Power BI. If you are a beginner wondering which tool to learn first or how they differ, this detailed Excel vs Power BI comparison will help you make an informed decision.
Both tools are developed by Microsoft Corporation and are widely adopted across industries. However, their purpose, capabilities, and scalability differ significantly.
This comprehensive guide explains everything step-by-step — features, advantages, limitations, use cases, career opportunities, salary prospects, and how to choose the right tool as a beginner.
Introduction to Microsoft Excel
Microsoft Excel is a spreadsheet application used for data entry, calculations, reporting, financial modeling, and analysis. It has been a cornerstone of business operations for decades.
Excel is commonly used for:
- Budgeting
- Accounting
- Data entry
- Financial analysis
- Small-scale reporting
- Forecasting
Its flexibility makes it suitable for individuals and small to mid-sized businesses.
Introduction to Power BI
Microsoft Power BI is a business intelligence (BI) and data visualization tool. It is designed to handle large datasets, connect to multiple data sources, and create interactive dashboards.
Power BI is commonly used for:
- Data visualization
- Business intelligence
- Real-time dashboards
- Enterprise-level reporting
- Big data analysis
Unlike Excel, Power BI focuses primarily on analytics and data visualization rather than manual data entry.
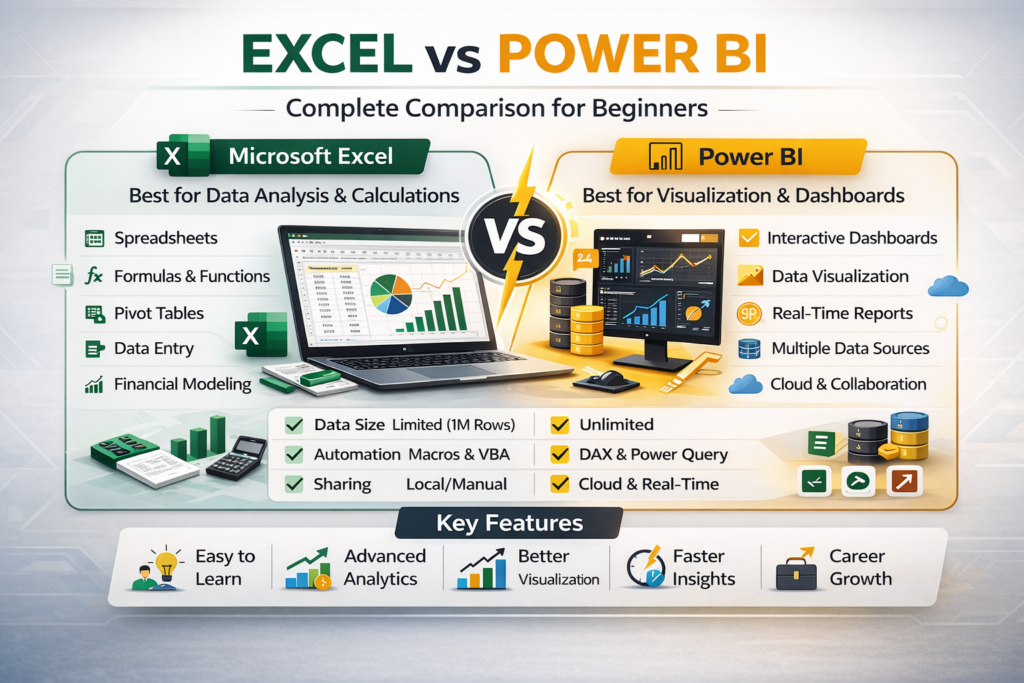
Excel vs Power BI Comparison: Overview Table
Feature | Excel | Power BI |
Primary Purpose | Spreadsheet & Analysis | Business Intelligence |
Data Handling | Small to medium datasets | Large datasets |
Visualization | Basic to advanced charts | Highly interactive dashboards |
Automation | Macros & VBA | DAX & Power Query |
Learning Curve | Beginner-friendly | Moderate |
Enterprise Use | Limited scalability | High scalability |
Real-Time Data | Limited | Strong |
Now let’s explore this comparison step-by-step.
1. Purpose and Core Functionality
Excel
Excel is primarily a spreadsheet tool. It is ideal for:
- Manual calculations
- Creating financial models
- Maintaining small databases
- Preparing MIS reports
It offers advanced formulas, pivot tables, charts, and automation through VBA.
Power BI
Power BI is built for analytics. It allows users to:
- Connect to multiple data sources
- Transform data using Power Query
- Create dynamic dashboards
- Share reports online
- Perform advanced analytics
In simple terms: Excel manages and analyzes data. Power BI visualizes and scales analytics.
2. Data Capacity and Performance
Excel
Excel supports large datasets but has row limitations (approximately 1 million rows per sheet). Performance may slow down with very large datasets.
Best for:
- Department-level data
- Medium-sized reports
Power BI
Power BI uses a data model that can handle millions of records efficiently. It compresses data and performs high-speed analytics.
Best for:
- Enterprise data
- Big data analytics
- Multi-source integration
For beginners handling small datasets, Excel is sufficient. For large corporate data, Power BI is superior.
3. Data Visualization
Excel Visualization
Excel provides:
- Bar charts
- Line charts
- Pie charts
- Pivot charts
- Conditional formatting
While useful, Excel dashboards are less interactive compared to Power BI.
Power BI Visualization
Power BI offers:
- Interactive dashboards
- Drill-down reports
- Custom visuals
- Filters and slicers
- Real-time updates
Power BI dashboards are dynamic and user-friendly.
4. Automation and Data Transformation
Excel Automation
Excel automation includes:
- Macros
- VBA (Visual Basic for Applications)
- Power Query
Automation in Excel is powerful but often requires manual setup.
Power BI Automation
Power BI uses:
- Power Query for data transformation
- DAX (Data Analysis Expressions) for calculations
- Scheduled data refresh
Power BI automation is more streamlined for reporting environments.
5. Ease of Learning for Beginners
Excel
Excel is easier to start with because:
- It is widely taught in schools and colleges
- Basic formulas are simple
- User interface is familiar
Most beginners should start with Excel before moving to Power BI.
Power BI
Power BI requires understanding:
- Data modeling
- Relationships
- DAX formulas
It has a moderate learning curve but is manageable with structured learning.
6. Collaboration and Sharing
Excel
Excel files are typically shared via:
- Shared drives
- Cloud platforms
Collaboration can become complex with multiple versions.
Power BI
Power BI allows:
- Cloud-based sharing
- Role-based access
- Online dashboards
- Secure report publishing
For team collaboration, Power BI is more efficient.
7. Real-Time Reporting
Excel has limited real-time capabilities unless connected to live data sources manually.
Power BI supports:
- Live dashboards
- Automatic data refresh
- Direct database connectivity
This makes Power BI better for management reporting.
8. Cost Comparison
Excel is part of Microsoft Office subscription plans.
Power BI offers:
- Free version (limited features)
- Pro and Premium paid versions
For individuals, Excel is more cost-effective initially.
9. Career Opportunities: Excel vs Power BI
Excel Career Roles
- MIS Executive
- Accounts Executive
- Financial Analyst
- Data Entry Specialist
- Reporting Analyst
Power BI Career Roles
- Business Intelligence Analyst
- Data Analyst
- Power BI Developer
- BI Consultant
- Analytics Specialist
Power BI roles often offer higher salary packages.
10. Salary Comparison
Excel Professionals
Entry-level: ₹20,000 – ₹35,000 per month
Mid-level: ₹40,000 – ₹60,000 per month
Power BI Professionals
Entry-level: ₹30,000 – ₹50,000 per month
Mid-level: ₹60,000 – ₹1,00,000+ per month
Power BI professionals typically earn more due to advanced analytics expertise.
11. When Should You Choose Excel?
Choose Excel if:
- You are a beginner
- You work with small datasets
- You need financial modeling
- You require manual data manipulation
- You work in accounting or operations
Excel is foundational.
12. When Should You Choose Power BI?
Choose Power BI if:
- You work with large datasets
- You need interactive dashboards
- You want enterprise reporting
- You aim to become a data analyst
- You require cloud-based sharing
Power BI is future-focused.
13. Can You Use Excel and Power BI Together?
Yes — and this is the smartest approach.
Power BI integrates with Excel:
- Import Excel data
- Use Excel Power Query
- Build reports from Excel files
Many professionals use Excel for data preparation and Power BI for visualisation.
14. Learning Path for Beginners
Step 1: Learn Excel basics
Step 2: Master advanced Excel (formulas, pivot tables)
Step 3: Learn Power Query
Step 4: Transition to Power BI
Step 5: Learn DAX
This step-by-step progression ensures smooth learning.
15. Which Tool Is Better for 2026?
Both tools remain relevant.
Excel is universal and foundational.
Power BI is growing rapidly in demand for analytics roles.
Instead of choosing one, professionals should aim to master both.
FAQ'S
Excel is a spreadsheet tool primarily used for data entry, calculations, and financial analysis, while Power BI is a business intelligence tool designed for data visualization, dashboard creation, and large-scale analytics. Excel is ideal for manual analysis, whereas Power BI is built for interactive reporting and enterprise-level insights.
No, Power BI is not replacing Excel. Instead, it complements Excel. Many professionals use Excel for data preparation and calculations, then use Power BI to create interactive dashboards and reports.
Excel is generally better for beginners because it has a simpler learning curve and is widely used in schools and workplaces. Once learners are comfortable with Excel, they can move to Power BI for advanced analytics and visualization.
Yes, Power BI can handle significantly larger datasets than Excel. Excel has row limitations and may slow down with very large files, whereas Power BI uses data modeling and compression to efficiently manage millions of records.
Excel is a strong foundation for data analysis, but most modern data analyst roles also require tools like Power BI, SQL, or Python. Learning Excel first and then transitioning to Power BI can improve career prospects.
Power BI offers more advanced and interactive data visualizations compared to Excel. While Excel provides charts and pivot charts, Power BI enables drill-down reports, dynamic dashboards, and real-time updates.
No, you do not need programming knowledge to start learning Power BI. However, understanding DAX (Data Analysis Expressions) will help you perform advanced calculations and modeling.
Yes, Excel remains highly relevant in finance, accounting, operations, and reporting roles. It is widely used across industries and continues to be an essential business tool.
Both offer career opportunities, but Power BI roles typically offer higher salary packages due to the growing demand for business intelligence and analytics professionals. However, Excel skills are foundational and required in most roles.
Yes, it is recommended to learn Excel first. Understanding formulas, pivot tables, and data handling in Excel makes it easier to transition into Power BI and understand data modeling concepts.
Final Conclusion: Excel vs Power BI Comparison
In this detailed Excel vs Power BI comparison, we explored their differences in purpose, functionality, scalability, learning curve, and career potential.
Excel is a powerful spreadsheet tool ideal for calculations, modeling, and departmental reporting.
Power BI is a business intelligence platform designed for interactive dashboards, enterprise reporting, and large-scale data analysis.
For beginners, start with Excel. Once comfortable, transition to Power BI to expand career opportunities.
In today’s competitive job market, professionals who understand both Excel and Power BI have a strong advantage.